 Instructional Biology
A knowledge graph in drug discovery is a map of biology that a computer can read. Instead of storing facts as separate lists, it links them: this drug binds that protein, that protein is made from a gene, the gene is associated with a disease. Researchers use these connected maps to ask questions no single database can answer on its own, such as which existing medicine might work for a different illness.[1] This article explains how a knowledge graph for drug discovery is built, what public examples look like, and what the published results show.
What is a knowledge graph?
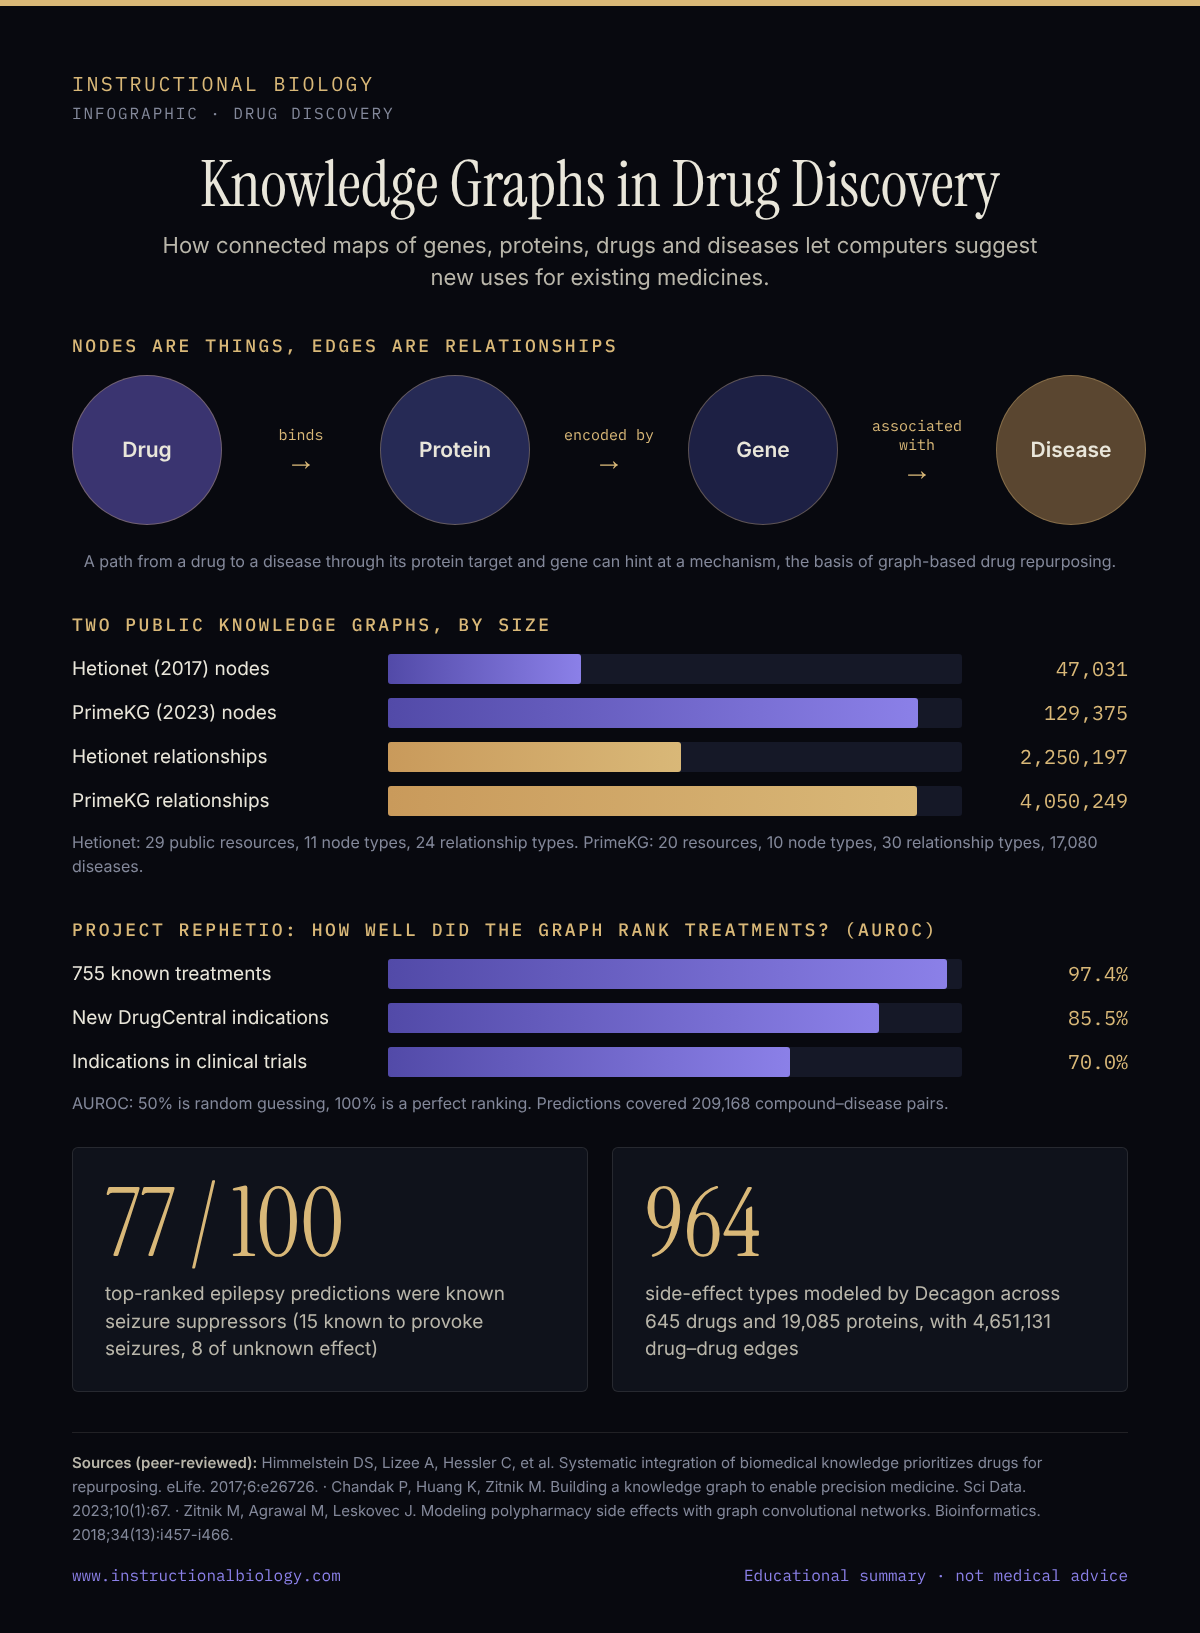
A knowledge graph represents biomedical concepts as nodes and the relationships between them as edges.[1] A node can be a gene, a protein, a drug, a disease, a symptom or a biological pathway. An edge says how two nodes relate: a drug binds a protein, a gene is associated with a disease, a drug causes a side effect.
The value is in the connections. A spreadsheet of drugs and a spreadsheet of diseases sit side by side without speaking to each other. Once both are joined through genes, proteins and pathways, a computer can follow chains of relationships from one end of biology to the other.
Where the facts come from
Most biomedical knowledge graphs are assembled from existing databases. Experts populate those databases in two main ways: manual curation, where trained curators read papers and record each relationship, and automated methods such as text mining, where software pulls relationships out of the literature.[1] Manual curation is precise but slow. Text mining is fast but needs careful checking. Many projects combine both.[1]
Choosing the right sources matters. A review led by researchers at AstraZeneca catalogued the public datasets suitable for building drug discovery knowledge graphs, sorted them by the kind of information they hold, and compared existing public drug discovery graphs.[4]
How big are public knowledge graphs for drug discovery?
Two openly published graphs show the scale involved.
- Hetionet (2017) integrated 29 public resources into 47,031 nodes of 11 types, joined by 2,250,197 relationships of 24 types. Its nodes include 1,552 small-molecule compounds and 137 complex diseases, along with genes, anatomy, pathways, side effects and symptoms.[2]
- PrimeKG (2023) integrated 20 resources into 129,375 nodes of 10 types and 4,050,249 relationships of 30 types, describing 17,080 diseases.[3] It was built for precision medicine and adds drug-disease edges for indications, contraindications and off-label use, which the authors note are often missing or sparse in other graphs.[3]
Millions of edges are far more than any person could hold in mind. That is exactly why these maps are built for computers to explore.
Knowledge graph drug discovery in practice: repurposing
Drug repurposing means finding a new use for a medicine that already exists. It is attractive because the compound is already de-risked, which can lower development costs and shorten timelines compared with starting from scratch.[6] The same review notes that repurposing still faces real technological and regulatory challenges.[6]
Knowledge graphs suit this problem because a good repurposing idea is usually a chain of connections. If a drug binds a protein, and the gene for that protein is involved in a disease, the path from drug to disease hints at a mechanism.[2]
The Hetionet experiment
Project Rephetio, the study that introduced Hetionet, put this idea to a systematic test. The team started from a gold standard of 755 known disease-modifying treatments. They then asked which types of paths through the graph appeared more often between real treatments than between drug-disease pairs that are not treatments.[2] Of the 1,206 path types they evaluated, 709 were significantly informative.[2]
Using those patterns, the model scored 209,168 compound-disease pairs.[2] The results were encouraging:
- Known treatments ranked highly, with an AUROC of 97.4%. AUROC is a standard accuracy score in which 50% means random guessing and 100% means perfect ranking.[2]
- On two external checks the model had not been trained on, it reached 85.5% for newer indications listed in the DrugCentral database and 70.0% for indications being tested in clinical trials.[2]
- For nicotine dependence, the model ranked bupropion ninth of all compounds. Bupropion was first approved for depression in 1985 and, after a chance observation that patients taking it smoked less, was approved for smoking cessation in 1997.[2] The graph recovered a repurposing that had originally happened by chance.
- For epilepsy, 77 of the top 100 predicted compounds were known to suppress seizures, 15 were known to provoke them, and 8 had no established effect, making those 8 candidates for further study.[2]
The epilepsy result is a useful reminder: a prediction is a hypothesis, not a treatment. Some top-ranked compounds were known to make seizures more likely, which is exactly why laboratory and clinical testing come next.
Beyond repurposing: side effects of drug combinations
Taking several medicines at once is common, and combinations carry a higher risk of side effects through drug-drug interactions.[5] These interactions are hard to study because they are rare and often not seen in relatively small clinical trials.[5]
The Decagon model, published in 2018, tackled this with a graph of 645 drugs and 19,085 proteins linked by 715,612 protein-protein edges, 18,596 drug-protein edges and 4,651,131 drug-drug edges, with each of 964 common side effects treated as its own edge type.[5] A graph neural network learned to predict which specific side effect a given drug pair might produce, and outperformed baseline methods by up to 69%.[5] The authors framed the output as a way to flag and prioritize drug combinations for follow-up pharmacological studies.[5]
This kind of computer-based screening is an example of in silico drug development, where experiments are planned and prioritized with models before they reach the lab.
How machines reason over the graph
A raw graph is too large to search by hand, so researchers turn it into numbers. Machine learning methods compress each node into a compact list of numbers, called an embedding, that preserves the graph's local and/or global structure.[1] Further models then use those embeddings to make predictions across genomic, pharmaceutical and clinical questions.[1]
Methods that capture a graph's structure in this compressed form are an active area of research.[1] The Poincaré disk explorer on this site shows one alternative geometry for such maps interactively.
What knowledge graphs cannot do yet
A knowledge graph is only as good as the facts that go into it. Building one means selecting suitable data sources[4] and reconciling databases that describe the same diseases in inconsistent ways.[3] Reviewers also highlight open challenges specific to drug discovery data.[4] Predictions still need experimental and clinical confirmation before they mean anything for patients.[2,5]
Used well, a graph narrows thousands of possibilities to a short list worth testing. That focus is the practical payoff.
Our research direction
At Instructional Biology, we are researching a Signaling Cascade Knowledge Graph that organizes signaling pathways in hyperbolic space. Our thesis is that a map built around how cells pass signals can help prioritize which biological questions are worth testing first. This work is research-stage.
Sources
- Nicholson DN, Greene CS. Constructing knowledge graphs and their biomedical applications. Comput Struct Biotechnol J. 2020;18:1414-1428. doi:10.1016/j.csbj.2020.05.017 · PMID 32637040
- Himmelstein DS, Lizee A, Hessler C, et al. Systematic integration of biomedical knowledge prioritizes drugs for repurposing. eLife. 2017;6:e26726. doi:10.7554/eLife.26726 · PMID 28936969
- Chandak P, Huang K, Zitnik M. Building a knowledge graph to enable precision medicine. Sci Data. 2023;10(1):67. doi:10.1038/s41597-023-01960-3 · PMID 36732524
- Bonner S, Barrett IP, Ye C, et al. A review of biomedical datasets relating to drug discovery: a knowledge graph perspective. Brief Bioinform. 2022;23(6):bbac404. doi:10.1093/bib/bbac404 · PMID 36151740
- Zitnik M, Agrawal M, Leskovec J. Modeling polypharmacy side effects with graph convolutional networks. Bioinformatics. 2018;34(13):i457-i466. doi:10.1093/bioinformatics/bty294 · PMID 29949996
- Pushpakom S, Iorio F, Eyers PA, et al. Drug repurposing: progress, challenges and recommendations. Nat Rev Drug Discov. 2019;18(1):41-58. doi:10.1038/nrd.2018.168 · PMID 30310233