 Instructional Biology
Our IP portfolio is organized into ten segments, and the business into ten revenue streams. Each revenue stream is protected by one or more of those segments, so a stream can be licensed, supplied or provided as a service on its own, without encumbering the others. Some segments, such as Composition of Matter and Provenance and Release, protect several streams at once. Where each program stands today is shown on Our Pipeline.
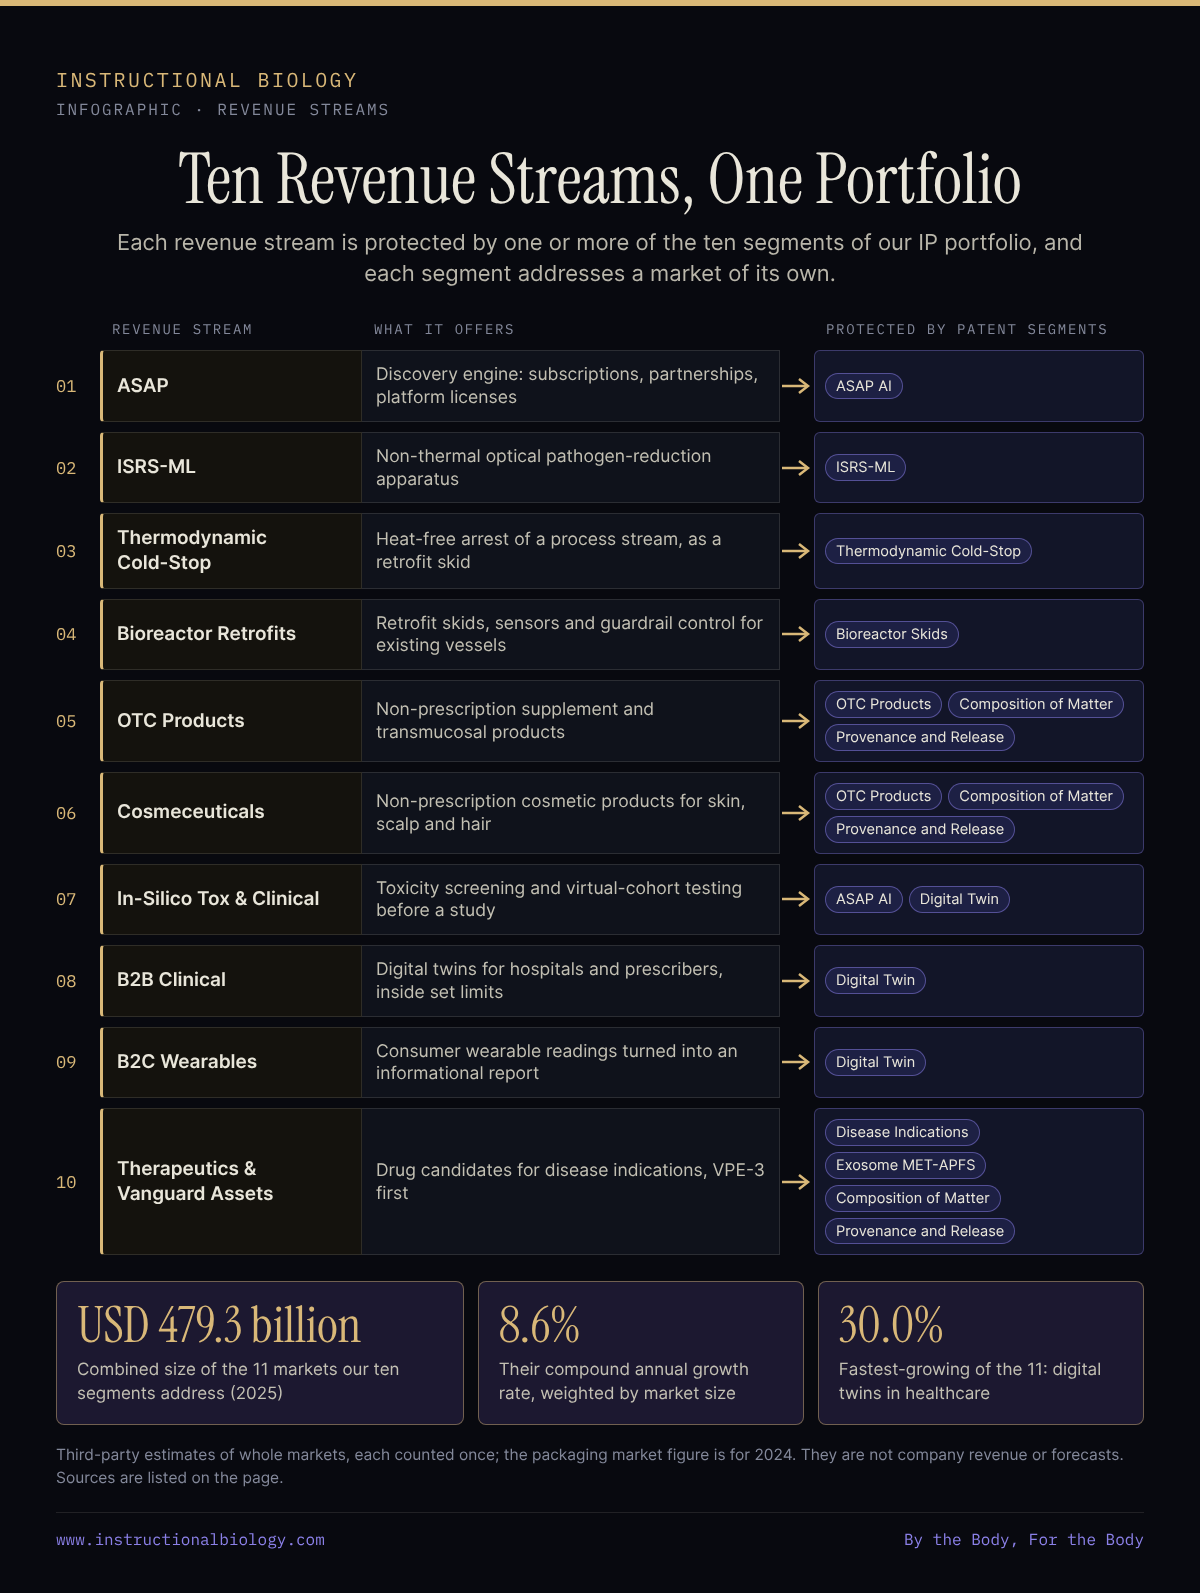
The ten revenue streams
01. ASAP
The Advanced Science AI Platform, our discovery engine, offered to pharma and biotech partners as subscriptions, discovery partnerships or platform licenses. Protected by: ASAP AI. Read more.
02. ISRS-ML
Non-thermal optical pathogen reduction, licensable as a standalone apparatus to blood banks, plasma processors and biologics manufacturers. Protected by: ISRS-ML. Read more.
03. Thermodynamic Cold-Stop
Skids, manifolds and methods that arrest a process stream rapidly and without heat, supplied as a retrofit. Protected by: Thermodynamic Cold-Stop.
04. Bioreactor Retrofits
Jacketed vessels, retrofit skids, in-line structural sensors and guardrail control loops for existing bioreactors, licensed to contract manufacturers and equipment vendors. Protected by: Bioreactor Skids. Read more.
05. OTC Products
Non-prescription dietary-supplement and transmucosal products. Our over-the-counter products are already at the Sales stage. Protected by: OTC Products, Composition of Matter, Provenance and Release.
06. Cosmeceuticals
Non-prescription cosmetic products for the skin, scalp and hair, presented without any claim that they diagnose, treat, cure or prevent disease. Protected by: OTC Products, Composition of Matter, Provenance and Release.
07. In-Silico Tox & Clinical
Computational toxicity screening and virtual-cohort testing for drug developers, combining ASAP with the digital twin before a study begins. Protected by: ASAP AI, Digital Twin. Read more.
08. B2B Clinical
Digital twins for hospitals, clinics and prescribers, working only inside limits the prescriber authorizes. Protected by: Digital Twin. Read more.
09. B2C Wearables
Consumer wearable signal processing that turns a wearable's readings into a personal, informational report, with no recommendation to start, stop or change any medicine. Protected by: Digital Twin. Read more.
10. Therapeutics & Vanguard Assets
Drug candidates developed for disease indications, VPE-3 first, each protected by its indication, its composition, its carrier and its release certification. Protected by: Disease Indications, Exosome MET-APFS, Composition of Matter, Provenance and Release. Read more.
The markets behind the ten segments
Each segment addresses a market that independent research firms already measure. The table gives each market's latest published size, its forecast and its compound annual growth rate (CAGR). Where two editions of a report differed, the higher figure is shown.
| Market and segment | Size | Forecast | CAGR |
|---|---|---|---|
| Cosmeceuticals [1] OTC Products | USD 71.23 bn (2025) | USD 152.58 bn by 2034 | 8.83% |
| Dietary supplements [2] OTC Products | USD 209.5 bn (2025) | USD 414.52 bn by 2033 | 8.9% |
| Opioid use disorder [3] Disease Indications | USD 6.0 bn (2025) | USD 12.9 bn by 2033 | 9.5% |
| Viral inactivation [4] ISRS-ML | USD 793.0 m (2025) | USD 1.98 bn by 2033 | 12.3% |
| Exosome-based therapeutics [5] Exosome MET-APFS | USD 56.3 m (2025) | USD 220.2 m by 2033 | 18.7% |
| Process chillers [6] Thermodynamic Cold-Stop | USD 7.0 bn (2025) | USD 11.3 bn by 2036 | 4.5% |
| Bioreactors [7] Bioreactor Skids | USD 13.8 bn (2025) | USD 38.9 bn by 2035 | 11.2% |
| AI in drug discovery [8] ASAP AI | USD 6.93 bn (2025) | USD 17.81 bn by 2035 | 9.9% |
| Digital twins in healthcare [9] Digital Twin | USD 2.5 bn (2025) | USD 33.4 bn by 2035 | 30.0% |
| Peptide therapeutics [10] Composition of Matter | USD 52.59 bn (2025) | USD 87.21 bn by 2035 | 5.19% |
| Anti-counterfeit pharmaceutical and cosmetics packaging [11] Provenance and Release | USD 108.9 bn (2024) | USD 248.9 bn by 2034 | 8.6% |
| 11 markets, all ten segments | USD 479.3 bn | 8.6% weighted |
Added together, counting each market once, the eleven markets come to USD 479.3 billion; every figure is for 2025 except the packaging market, which is for 2024. Weighted by each market's size, their compound annual growth rate is 8.6%. The weighted rate is our own calculation from the published figures. These are estimates of whole markets, not Instructional Biology revenue or forecasts.
How the streams are metered
Every stream is designed to be metered on an immutable ledger rather than sold once as a delivered artifact: by record emitted, by volume treated, by lot released, by installation-hour or by subject enrolled. A license can exclude a defined field of use, and the control system will not run a recipe that falls inside an excluded field.
For partnership or licensing conversations about any stream, see Partnerships and Licensing.
Sources
- Precedence Research, cosmeceuticals market. precedenceresearch.com
- Grand View Research, dietary supplements market. nutraceuticalbusinessreview.com · bolsamania.com
- Grand View Research, opioid use disorder market. grandviewresearch.com
- Grand View Research, viral inactivation market. grandviewresearch.com
- Grand View Research, exosome-based therapeutics market. grandviewresearch.com
- Fact.MR, process chillers market. factmr.com
- Global Market Insights, bioreactors market. gii.tw
- Precedence Research, ai in drug discovery market. precedenceresearch.com
- Roots Analysis, digital twins in healthcare market. giikorea.co.kr · rootsanalysis.com
- Precedence Research, peptide therapeutics market. precedenceresearch.com
- Global Insight Services, anti-counterfeit pharmaceutical and cosmetics packaging market. giiresearch.com