 Instructional Biology
OTC Products is Instructional Biology's line of non-prescription, over-the-counter products: dietary supplements, and transmucosal products, which are absorbed through a mucous membrane such as the lining of the mouth.
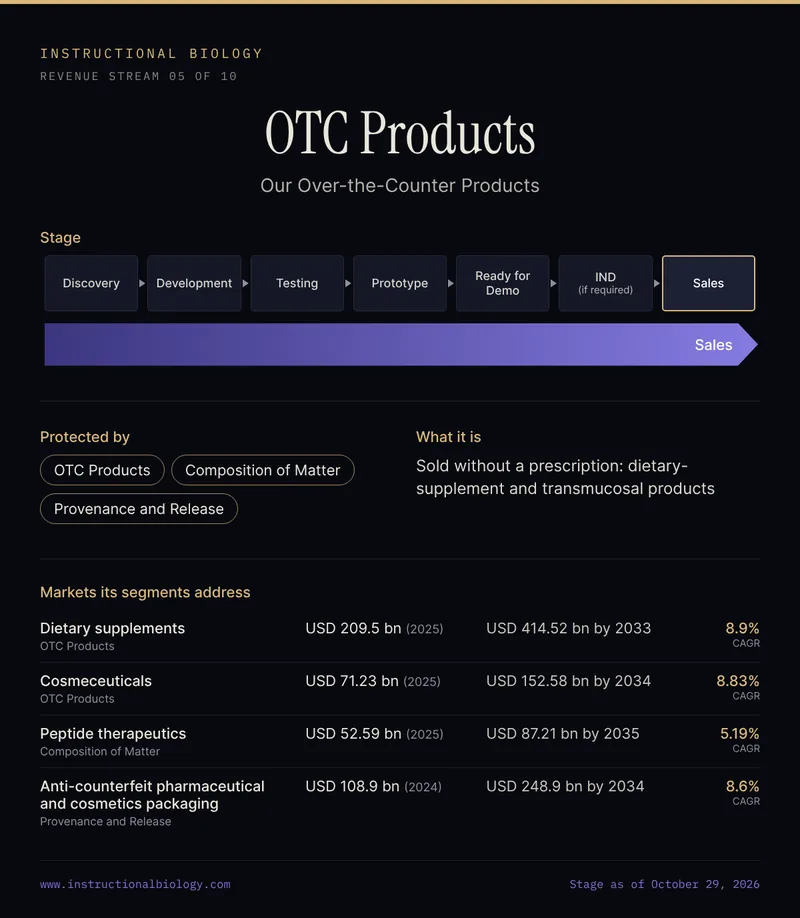
Where It Stands
OTC Products is at Sales, the last of the seven stages on Our Pipeline: Discovery, Development, Testing, Prototype, Ready for Demo, IND (if required) and Sales. It is the first of our ten revenue streams to reach Sales.
The Segments That Protect It
Three segments of our IP portfolio protect this stream. OTC Products covers the products themselves. Composition of Matter covers what they are made of. Provenance and Release covers where each lot's material comes from and how each lot is certified before it is released. The same three segments protect our Cosmeceuticals, and Composition of Matter and Provenance and Release also protect our Therapeutics & Vanguard Assets.
The Markets Behind Its Segments
Each segment of our IP portfolio addresses a market that independent research firms already measure. The table gives each market's latest published size, its forecast and its compound annual growth rate (CAGR), from the same sources as Ten Revenue Streams.
| Market and segment | Size | Forecast | CAGR |
|---|---|---|---|
| Dietary supplements [1] OTC Products | USD 209.5 bn (2025) | USD 414.52 bn by 2033 | 8.9% |
| Cosmeceuticals [2] OTC Products | USD 71.23 bn (2025) | USD 152.58 bn by 2034 | 8.83% |
| Peptide therapeutics [3] Composition of Matter | USD 52.59 bn (2025) | USD 87.21 bn by 2035 | 5.19% |
| Anti-counterfeit pharmaceutical and cosmetics packaging [4] Provenance and Release | USD 108.9 bn (2024) | USD 248.9 bn by 2034 | 8.6% |
These are estimates of whole markets, not Instructional Biology revenue or forecasts.
For partnership or licensing conversations about OTC Products, see Partnerships and Licensing.
Sources
- Grand View Research, dietary supplements market. nutraceuticalbusinessreview.com · bolsamania.com
- Precedence Research, cosmeceuticals market. precedenceresearch.com
- Precedence Research, peptide therapeutics market. precedenceresearch.com
- Global Insight Services, anti-counterfeit pharmaceutical and cosmetics packaging market. giiresearch.com